
Fotolia
Grafana Enterprise brings observability stack on premises
Grafana Labs is launching a new on-premises project stack for data observability, based on a series of open source projects that the company leads or supports.

Grafana Labs is bringing its observability suite down from the cloud with the on-premises Grafana Enterprise Stack, which became generally available Wednesday.
The Grafana Enterprise Stack includes Grafana Enterprise, Enterprise Logs and Enterprise Metrics. The new enterprise stack is essentially a version of the Grafana Cloud service that can run on premises. Grafana Labs' tools are largely based on open source projects that the company leads or supports, including the company's namesake open source Grafana observability project. The Enterprise Logs project is based on the company's Loki open source project, while Enterprise Metrics makes use of the open source Prometheus monitoring project, which is led by the Cloud Native Computing Foundation.
"By offering the on-premises stack and the SaaS version of Grafana with Grafana Cloud, Grafana allows enterprises to implement Grafana faster and in an easier way, all enabling them to have better insights," said Holger Mueller, principal analyst and vice president at Constellation Research.
Anthony Woods, co-founder and CTO of Grafana Labs, said that like others in the industry, his company has seen the widespread adoption of SaaS-based models for technology deployment. He added that the Grafana Enterprise Stack is for customers that can't use the Grafana Cloud offering but still want to have a centralized observability platform.
While the Grafana Enterprise Stack is an on-premises platform, Woods said it can be used to enable a hybrid deployment for observability, where users have data assets both on premises and in the cloud.
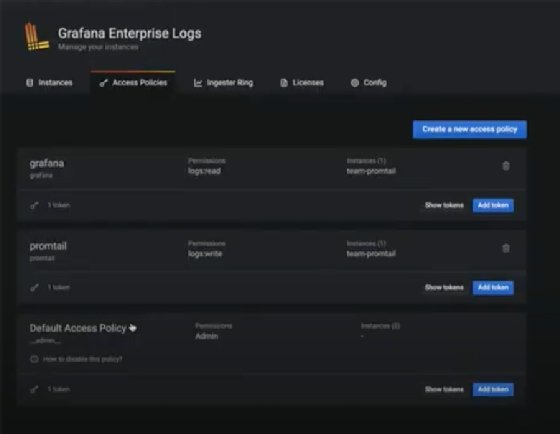
How Grafana Loki improves observability with Enterprise Logs
A key part of the Grafana Enterprise Stack is the Enterprise Logs capability, which is based on the open source Loki project that Grafana leads.
Woods explained that Loki has a unique indexing approach, which is essentially not about indexing the data itself, but just the metadata. It's an approach that he said is focused more on the developer use case for logs, which is largely around troubleshooting.
"Loki is really around enabling the data observability use case, understanding and being able to troubleshoot and diagnose what's happening in applications," Woods said.
With the Enterprise Logs offering that is now part of the Grafana Enterprise Stack, Woods said Loki has been extended with some additional capabilities that are really required for large organizations to be able to run it themselves. Among the additional enterprise capabilities are security, compliance and scalability features.
Grafana project continues to move forward
The Grafana Enterprise Stack includes the Grafana observability project as a foundational component. Grafana 7.4 was released Feb. 4, marking the latest update for the open source project.
Wood said the open source Grafana 7.4 update adds a number of visualization capabilities to help users display data.
"We've got some new visualization modes just to make graphs look a little bit cleaner that will fit with data models that people might have," he said.