The value of PDF data extraction: Sifting for hidden data
During the process of data cleaning, there's a way to extract valuable hidden data. Learn how in this excerpt from 'Cleaning Data for Effective Data Science.'
Sometimes, data lives in formats that take extra work to ingest.
For common and explicitly data-oriented formats, common libraries already have readers built into them. A greater difficulty often arises because a given format is not a data format per se but exists for a different purpose. Nonetheless, often there is data somehow embedded or encoded in the format that we would like to use. For example, Portable Document Formats (PDFs) are generally designed for human readers and yet also often contain tabular or other data that we data scientists would like to process. Of course, in both cases, we would rather have the data itself in some separate, easily ingestible format, but reality does not always live up to our hopes.
There are a great many commercial tools for extracting data hidden away in PDF files. Unfortunately, many organizations -- government, corporate and others -- issue reports in PDF format but do not provide data formats more easily accessible to computer analysis and abstraction. This happens enough to create a cottage industry of tools for semi-automatically extracting data out of these reports.
(This book does not recommend the use of proprietary tools, for which there is no guarantee of maintenance and improvement over time. Plus, of course, those tools also cost money and are an impediment to cooperation among data scientists who work together on projects without necessarily residing in the same "licensing zone.")
There are two main elements that are likely to interest us in a PDF file. An obvious one is tables of data and those are often embedded in PDFs. Otherwise, a PDF can often simply be treated as a custom text format, as we discuss in a section below. Various kinds of lists, bullets, captions or simply paragraph text might have data of interest to us.
 Click here to learn more
about this book, from Packt
Publishing.
There are two open source tools I recommend for extraction of data from PDFs: one is the command-line tool pdftotext, which is part of the Xpdf and derived Poppler software suites. The second is a Java tool called tabula-java. Tabula-java is, in turn, the underlying engine for the GUI tool Tabula and also has language bindings for Ruby (tabula-extractor), Python (tabula-py), R (tabulizer) and Node.js (tabula-js). Tabula creates a small web server that allows interaction within a browser to do operations like creating lists of PDFs and selecting regions where tables are located. The Python and R bindings also allow the direct creation of data frames or arrays, with the R binding incorporating an optional graphical widget for region selection.
In this article, we do not use any of the language bindings nor the GUI tools. For one-off selection of single-page data sets, the selection tools could be useful, but for automation of recurring document updates or families of similar documents scripting is needed. Moreover, while the various language bindings are perfectly suitable for scripting, we can be somewhat more language agnostic in this section by limiting ourselves to the command-line tool of the base library.
As an example, let us use a PDF that was ou
tput from the preface of this book, Cleaning Data for Effective Data Science. [Note: There may have been small wording changes by the time you read this, and the exact formatting of the printed book or e-book will surely be somewhat different from this draft version. However, this section nicely illustrates tables rendered in several different styles that we can try to extract as data.]
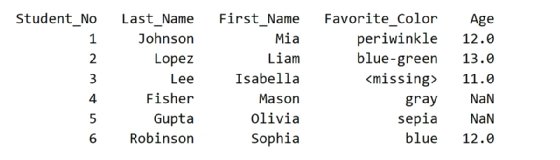
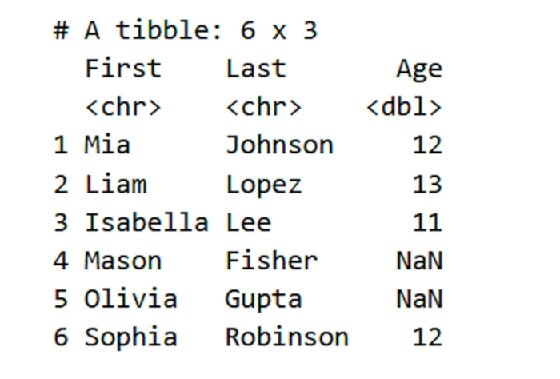
There are three tables, in particular, which we would like to capture. The first table, shown in Figure 1, is rendered by Pandas. The second, shown in Figure 2, is rendered by tibble, with corresponding minor presentation differences.
A few pages later in the book, a third table is included that looks somehow different again:
Running tabula-java requires a rather long command line, so I have created a small bash script to wrap it on my personal system:
#!/bin/bash
# script: tabula
# Adjust for your personal system path
TPATH='/home/dmertz/git/tabula-java/target'
JAR='tabula-1.0.4-SNAPSHOT-jar-with-dependencies.jar'
java -jar "$TPATH/$JAR" $@
Extraction will sometimes automatically recognize tables per page with the -- guess option, but you can get better control by specifying a portion of a page where tabula-java should look for a table. We simply output to STDOUT in the following code cells, but outputting to a file is just another option switch.
In [15]:
%%bash
tabula -g -t -p5 data/Preface-snapshot.pdf
Out [15]:
[1]:,,Last_Name,First_Name,Favorite_Color,Age
"",Student_No,,,,
"",1,Johnson,Mia,periwinkle,12.0
"",2,Lopez,Liam,blue-green,13.0
"",3,Lee,Isabella,<missing>,11.0
"",4,Fisher,Mason,gray,NaN
"",5,Gupta,Olivia,sepia,NaN
"",6,Robinson,Sophia,blue,12.0
Tabula does a good, but not perfect, job. The Pandas style of setting the name of the index column below the other headers threw it off slightly. There is also a spurious first column that is usually empty strings, but has a header as the output cell number. However, these small defects are very easy to clean up, and we have a very nice CSV of the actual data in the table. Remember from just above -- see Figure 1 and Figure 2 -- Tabula-java only captured the first one, which is not unreasonable but is not all the data we might want. Slightly more custom instructions (determined by moderate trial and error to determine the region of interest) can capture the second one.
In [16]:
%%bash
tabula -a'%72,13,90,100' -fTSV -p5 data/Preface-snapshot.pdf
Out [16]:
First Last Age
<chr> <chr>
bl>
Mia Johnson 12
Liam Lopez 13
Isabella Lee 11
Mason Fisher NaN
Olivia Gupta NaN
Sophia Robinson 12
To illustrate the output options, we chose tab-delimited rather than comma-separated for the output. A JSON output is also available. Moreover, by adjusting the left margin (as percent, but as typographic points is also an option), we can eliminate the unnecessary row numbers. As before, the ingestion is good but not perfect. The tibble formatting of data type markers is superfluous for us. Discarding the two rows with unnecessary data is straightforward.
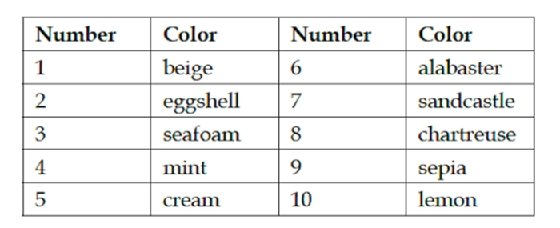
Finally, for this example, let us capture the table that does not have any of those data frame library extra markers. [See Figure 3.] This one is probably more typical of the tables you will encounter in real work. For the example, we use points rather than page percentage to indicate the position of the table.
In [17]:
%%bash
tabula -p7 -a'120,0,220,500' data/Preface-snapshot.pdf
Out [17]:
Number,Color,Number,Color
1,beige,6,alabaster
2,eggshell,7,sandcastle
3,seafoam,8,chartreuse
4,mint,9,sepia
5,cream,10,lemon
The extraction here is perfect, although the table itself is less than ideal in that it repeats the number/color pairs twice. However, that is likewise easy enough to modify using data frame libraries.
The tabula-java tool, as the name suggests, is only really useful for identifying tables. In contrast, pdftotext creates a best-effort purely text version of a PDF. Most of the time this is quite good. From that, standard text processing and extraction techniques usually work well, including those that parse tables. However, since an entire document (or a part of it, selected by pages) is output, this lets us work with other elements such as bullet lists, raw prose or other identifiable data elements of a document.
In [18]:
%%bash
# Start with page 7, tool writes to .txt file
# Use layout mode to preserve horizontal position
pdftotext -f 7 -layout data/Preface-snapshot.pdf
# Remove 25 spaces from start of lines
# Wrap other lines that are too wide
sed -E 's/^ {,25}//' data/Preface-snapshot.txt |
fmt -s |
head -20
Out [18]:
- Missing data in the Favorite Color field should be substituted with
the string <missing>.
- Student ages should be between 9 and 14, and all other values are
considered missing data.
- Some colors are numerically coded, but should be de-aliased. The
mapping is:
Number Color Number Color
1 beige 6 alabaster
2 eggshell 7 sandcastle
3 seafoam 8 chartreuse
4 mint 9 sepia
5 cream 10 lemon
Using the small test data set is a good way to test your code. But try also manually adding more rows with similar, or different, problems in them, and see how well your code produces a reasonable result.
The tabular part in the middle would be simple to read as a fixed width format. The bullets at the top or the paragraph at the bottom might be useful for other data extraction purposes. In any case, it is plain text at this point, which is easy to work with.
This article contemplated data sources that you may not, in your first thought, think of as data per se. Within PDF documents, the intention is usually to present human-readable content that only contains analyzable data as a secondary concern.
In the ideal situation, whoever produced those less-structured documents will also provide structured versions of the same data; however, that ideal situation is only occasionally realized. A few nicely written free software libraries let us do a reasonable job of extracting meaningful data from these sources, albeit always in a way that is somewhat specific to the particular document, or at least to the family or revisions of a particular document.
About the author
David Mertz, Ph.D. is the founder of KDM Training, a partnership dedicated to educating developers and data scientists in machine learning and scientific computing. He created a data science training program for Anaconda Inc. and was a senior trainer for them. With the advent of deep neural networks, he has turned to training our robot overlords as well.
He previously worked with D. E. Shaw Research and is a past director of the Python Software Foundation. David remains co-chair of its Trademarks Committee and Scientific Python Working Group.