raw data (source data or atomic data)
What is raw data (source data or atomic data)?
Raw data is the data originally generated by a system, device or operation, and has not been processed or changed in any way. It. Raw data can come from a wide range of sources, such as machinery, monitors, instruments, sensors, surveys, log files, online transactions and countless other operations and places. Raw data is also called source data, atomic data and primary data.
Unlike raw data, processed data has been corrected, cleansed, aggregated or in some other way transformed.
Most analytics projects collect raw data first and then process and analyze it. The analyzed data is presented to decision-makers and other interested parties in a format that makes the information much easier to understand than if it were still in its raw form. From the refined information, they can gain important insights into the data and make more informed decisions. Raw data that has undergone processing is sometimes referred to as cooked data.
Raw data can lead to useful insights only if it has been carefully collected and stored to ensure its reliability when needed. If it is not reliable, it becomes more difficult -- if not impossible -- to derive meaningful information from the data. Data integrity is essential to the process, as data analysis can produce accurate results only if it starts with raw data that is complete, accurate and preserved in its original, preprocessed state.
Most organizations have come to recognize the value of raw data in all its forms. For example, many organizations now buy or sell consumer data that can be used to build comprehensive user profiles or target specific audiences. IT teams also use operational and logging data to track system performance and streamline business practices, while security teams use access logs and similar resources to identify potential computer breaches and track what data might have been accessed by hackers.
What are the two types of raw data?
Raw data can come from multiple sources, delivered in numerous formats and stored in multiple repositories. For example, a single analytics project might incorporate transactional data stored in an on-site relational database, customer data in comma-separated value files or flat files downloaded from a data broker, and survey results collected and maintained on a service provider's cloud computing platform.
Despite the various sources and formats, most raw data can be categorized as the following:
- Quantitative raw data. This is numerical data that can be counted, measured or quantified in some way. It might include student grades, baseball scores, temperature readings, sales figures, click-through rates or other types of quantifiable data.
- Qualitative raw data. Qualitative data is descriptive in nature and cannot be easily synthesized down to numerical values. It might include comments, responses to questionnaires, feedback from focus groups or other narrative types of input.
Although analytics and data-related projects often rely heavily on quantitative raw data, qualitative data can also be useful, depending on what the organization hopes to learn from the data. Some projects incorporate both types of data to gain different insights into the patterns they uncover.
What are examples of raw data?
Raw data can come from a wide variety of sources, ranging from computer logs to point-of-sale terminals to internet of things devices. The following examples are just some of the many sources of raw data:
- Website click rates.
- Sales figures.
- Supply inventories.
- Survey responses.
- Computer log files.
- Sports scores.
- Social media posts.
- Atmospheric readings.
- Real estate listings.
- Census data.
- Raw video files.
- Employee performance ratings.
- Customer purchases.
- Product reviews.
From these and other source types, data scientists and analysts process the raw data, analyze it to answer specific questions and prepare it for presentation. The prepared data can be made available to those who need it through the use of spreadsheets, reports, visualizations, dashboards, key performance indicators and other presentation tools.
How is raw data used?
Most organizations do not realize the full value of their data until they have processed and analyzed it. However, the information derived from this analysis is only as reliable as the raw data on which it is based. If the raw data has been properly collected and stored, their analytics are much more likely to be accurate and complete.
An organization might choose to delete its raw data after the analytics are finished, although many organizations retain the data to verify their processing and analytics processes. They might also archive it in case they find ways to derive additional value from the data at a later time.
As the cost-per-gigabyte of storage has decreased, retaining raw data has become more affordable, although there are still challenges around data retention as the volumes continue to increase. Even so, retaining the data could prove well worth the investment if additional insights can be derived from it at some point in the future.
As with any data, raw data might contain personally identifiable information (PII). Applicable regulations can make an organization liable for how they store and transmit PII data. IT and data teams should take steps to protect the data no matter where it resides or how long it is retained.
To this end, they should implement a comprehensive data governance policy, including access controls and data retention policies that help limit the risks of data leaks. They might also use tools such as data anonymization, which removes PII from the raw data depending on applicable regulations.
Organizations typically need to prepare -- or process -- their raw data before it can be used. This processing can include parsing the data, removing outliers, correcting errors, supplying missing values, aggregating data from multiple sources, or in other ways formatting and transforming the data. Such preparation is sometimes called massaging or crunching the data.
There are many ways to use raw data, ranging from the simple to the complex. For example, users might do nothing more than import the data into a spreadsheet such as Microsoft Excel or Google Sheets. There they can format, organize and graph the data to reveal simple trends and summarize the data.
In some cases, data teams might deploy business intelligence (BI) platforms or other complex systems to provide users with information such as financial trending, business forecasting or other market concerns. They might also use raw data as a foundation to build machine learning models to support more advanced analytics. An organization might also use raw data as part of an alerting system.
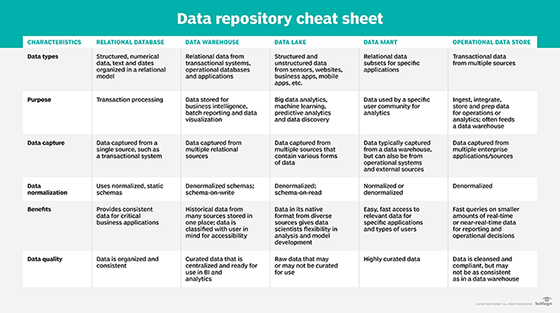
Some organizations will set up a central repository, such as a data lake or data warehouse, and then feed raw data into it. Such repositories can collect raw data from multiple sources and, in some cases, process and correlate the data automatically, although this process can require manual intervention. Analysists can then use BI tools or other types of tools to query the data in the repository and retrieve the information they need.
The process of collecting and prepping data for analytics applications requires a practical and effective approach. Explore some data preparation best practices for analytics applications.