Data modeling for the business: What is a data model?
Learn about high-level data modeling, what a data model is and how business and IT can use logical data modeling to plan a data design with these best practices from a data modeling handbook and guide.
Data Modeling for the Business: A Handbook for Aligning the Business with IT using High-Level Data Models 
Getting business and IT on the same page during a project is key to an initiative's success -- and utilizing data models can help do just that. In this chapter from Data Modeling for the Business: A Handbook for Aligning the Business with IT using High-Level Data Models, learn what a data model is and how to create a data model and read data modeling best practices. Find out how business and IT can use high-level data models and logical data modeling to plan a successful data design.
From the authors: Ever try getting Business and IT to agree on the project scope for a new application? Or try getting Marketing and Sales to agree on the target audience? Or try bringing new team members up to speed on the hundreds of tables in your data warehouse — without them dozing off?
You can be the hero in each of these and hundreds of other scenarios by building a High-Level Data Model. The High-Level Data Model is a simplified view of our complex environment. It can provide a powerful communication tool of the key concepts within our application development projects, business intelligence and master data management programs, and all enterprise and industry initiatives.
Learn about the High-Level Data Model and Master the techniques for building a High-Level Data Model, including a comprehensive ten-step approach. Know how to evaluate toolsets for building and storing your models. Practice exercises and walk through a case study to reinforce your modeling skills.
Chapter 1 -- What is a Data Model?
A data model is a visual representation of the people, places and things of interest to a business. It is used to facilitate communication between business people and technical people. A data model is composed of symbols that represent the concepts that must be communicated and agreed upon, and is therefore often referred to as a blueprint for data. Like a building architect, who creates a series of diagrams or blueprints from which a house can be constructed, a data modeler/architect creates diagrams from which a database may be built.
The blueprint analogy is often used because there are many parallels between blueprints, which many people are familiar with, and a data model, which few people outside of IT have seen. (Hopefully, this book will help to change that!). The most obvious parallel is that a blueprint translates a very complex and technical undertaking into a set of visual diagrams that a layperson can understand. This is the goal of a data model, as well — to take business concepts and the complex rules required to create a database and simplify them into an intuitive picture that both business people and technical engineers can understand. Just as a homeowner is involved in the design of their house before the technical design and building takes place, so, too, should business people be involved in the design of the data models from which the databases that run their organization are built.
Blueprints are created at several different levels of detail: from the high-level requirements, to the basic architectural layout, to the detailed wiring and plumbing designs. If you're getting ready to build a house, the architect normally starts by asking about your requirements — do you want a single story or multiple story building, a ranch or a cape? Do you want a front porch or a deck? How are you going to use this house? Will it be a vacation home or a full-time home for a large family? The architect uses these requirements to develop a series of diagrams for you to review. The first diagram is often a picture, or mock-up, of what the house might look like.
As a hypothetical example, let's say that I ask my architect for a small vacation home with a nice front porch. He might come back to me with this picture, showing an example of what the house could look like. See Figure 1.1.
Figure 1.1 – A Small, Wooden House with a Front Porch
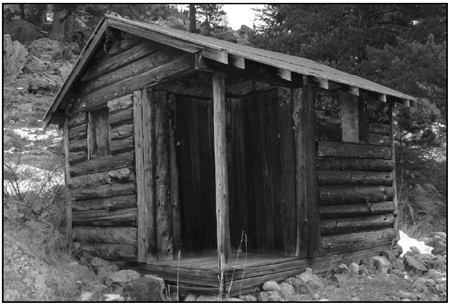
Um... I was pleased that he was trying to keep my costs down, but I had something a little larger in mind. I should have been a little more precise about what I meant by 'small' and maybe he had a different definition of 'vacation'. What he showed me might work for an ice-fishing weekend, but it certainly wouldn't be appropriate for a week-long ski vacation with a dozen of my friends. And I had forgotten to mention that I wanted to retire there someday, so it really needed to function as a primary residence as well. I asked him to make it bigger and explained my requirements in more detail. I actually tried to draw it myself and created a rough sketch of what I had in mind, shown in Figure 1.2.
Figure 1.2 – A Small, Wooden House with a Front Porch
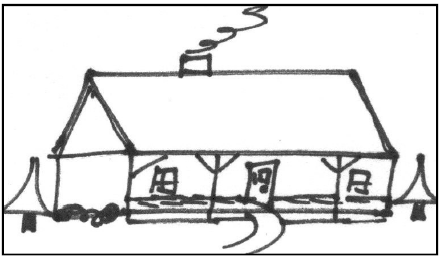
My picture was pretty simple, but from the combination of my verbal description and the picture that I drew, he had enough information to come up with a better design, shown in Figure 1.3.
Figure 1.3 – Architect's Sketch of House
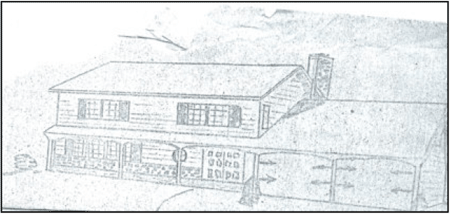
This was just what I had in mind. Based on his experience in designing houses for other customers, my architect also made some suggestions about things that I hadn't thought of — like a heated garage for the winter and a second story with extra bedrooms for guests. I'm certainly glad we came to an understanding at this high-level before he started building! We saved a lot of expense and frustration that way. Once we agreed on the basic requirements for the house, the architect went a step further and drew a more detailed diagram to show the arrangement of the rooms, appliances, etc. There were several such diagrams, each with a particular focus to highlight an area of the house in detail. It would have been too confusing to see the entire house in a single diagram, so he broke up the diagram by floor: one for the main floor, one for the second floor, and another for the attic. He showed me the diagram for the main floor, a subset shown in Figure 1.4.
Figure 1.4 – Blueprint of a House (Subset Shown)
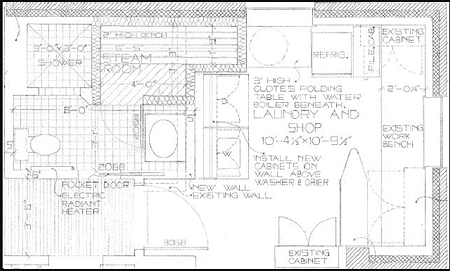
This gave me a much better sense of the details of the house. I wasn't initially sure what some of the symbols meant, but it didn't take me long to figure out that a slanted line meant that a door was opening in a certain direction and that double lines meant a window opening, etc. I got the basic idea, although I'm sure the builders would get much more from it than I did.
I was able to understand it well enough to change some of the mistakes that I saw, too. Once I saw everything laid out in the picture, I could get a better sense of how things fit together and the relationships between them. For example, I didn't want the master bedroom opening into the kitchen. I should have been clearer on these types of rules before, but (a) I wasn't able to articulate some things clearly enough to the architect and (b) I didn't realize there were mistakes until I saw them drawn out. Once I saw them in this picture, I was able to correct them easily. The picture was an excellent medium for communicating what the architect envisioned based on what I had told him and for me to identify and correct misunderstandings.
The architect then showed me the various wiring and plumbing diagrams, subset shown in Figure 1.5. These were much too technical for me to understand, but I'm glad somebody was taking care of this stuff. I definitely want the electricity to work, but don't bother me with the details.
Figure 1.5 – Physical Wiring Diagram (Subset Shown)
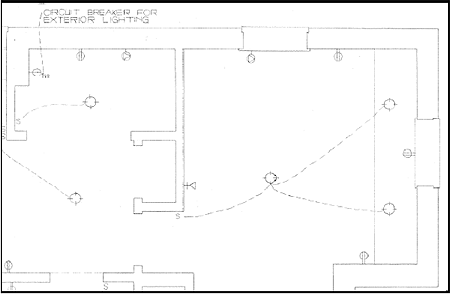
In this house example, we used several layers of diagrams: a very high-level picture to align on the scope of the project (Figure 1.1 and Figure 1.2), a high-level picture to ensure that we had the same vision of the house (Figure 1.3), then a more detailed layout of the architecture (Figure 1.4), and finally a detailed, technical design diagram of the physical infrastructure (Figure 1.5).
Each level of the blueprint has several components broken down by a particular function: a picture of the front of the house vs. the back; the layout of the first floor vs. the second, a physical wiring diagram vs. a plumbing diagram. Each level has a particular audience, owner and purpose. In the high-level diagrams, I was even able to do some of the design myself. As we got more detailed, however, I needed the expertise of an architect to fill out the structural specifications. Once we got to the physical layer, both the architect and I needed to bring in a technical contractor to build the diagrams. The same holds true for data models. We'll demonstrate some of the parallels in the rest of this chapter.
The chapters that follow will go into much greater detail on the different levels of data models and the high-level data model in particular, but to summarize, data modeling traditionally starts with a very high-level diagram to align on scope and common meaning, then a high-level picture to help gather business requirements and clarify understanding of basic concepts. The logical level follows, showing more detail while incorporating business logic and business rules. The physical level shows the technical details for implementation as a database or data structure.
This 'top-down' approach of starting with a very high-level design and moving successively into more detail is one way of looking at data design in an organization. Because we're often building on top of existing systems, it's more common to start from the 'bottom-up', similar to trying to visualize what the house is supposed to look like when only the physical wiring diagrams are shown. We'll go into more detail on various approaches to data design in Chapter 8 with top-down, bottom-up, and hybrid approaches. For now, suffice it to say that the real world is rarely as well-organized as we're describing here. We hope this book will help change that, at least for data management. World peace and an organized sock drawer come next.
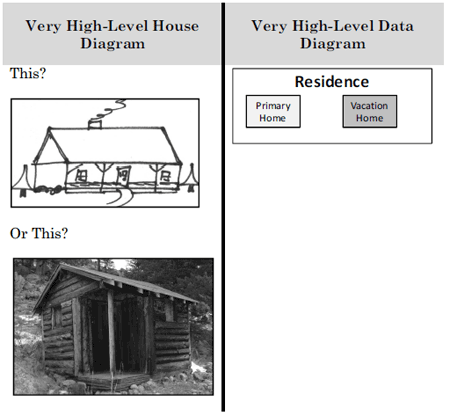
Now, let's walk through an example of each of these levels with a corresponding example for both house design and data design. We started our house example by using a very high-level picture to describe the scope and basic requirements. I needed to clarify to my architect what I meant by 'house', what this house was going to be used for, and what was going to be included in the project. In a data model, we may use a picture containing a simple set of boxes that clarify the differences between, for example, a primary home and a vacation home. The house diagrams were created by the architect and me, a layperson. Similarly, in the data world, both a business person and a data architect would work together on the data model diagrams, with business people able to do much of the work themselves. See Figure 1.6 for an example of how a very high-level house diagram corresponds to a very high-level data diagram.
Figure 1.6 – Blueprint and Data Diagram at a Very High Level
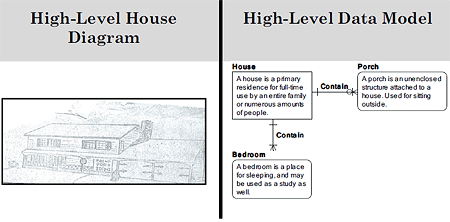
After we've reached consensus on what the scope of the project is, it's time to go deeper into the details of the design. For my house example, the architect drew a high-level picture to show what he had in mind for the house — that it would have a front porch, be big enough to sleep a large number of people, etc. For data, we use a high-level data model to clarify what information is important, how basic concepts are defined and how these concepts relate to each other.
In Figure 1.7, a set of boxes and lines clarifies what I mean by a 'house'. There is a textual description of a house and we also show how the concept of house relates to other concepts I had in mind. For example, a house isn't a 'house' to me unless it has a front porch; and it must have multiple bedrooms. We'll go into more detail regarding the exact notation for these models in Chapter 3, but for now, you should be able to understand what this model is trying to express.
Note again the roles involved in creating this level of diagram. I was collaborating closely with the architect, contributing content and examples. He might have guided me in this process, but I was heavily involved, so I felt a greater sense of ownership in having designed 'my' house.
Figure 1.7 – Blueprint and Data Diagram at a High Level
Once we've agreed on what a 'house' is, and how big of a project we have on our hands, we're ready to go into more detail. For the building architect, this means drawing out detailed floor plans to show the layout of the house, the size and use of the rooms, and how the rooms fit together. In data modeling, we have increasingly more detailed levels of the diagram to show the layout of the data, the size and type of the data, and how various objects relate to each other. See Figure 1.8.
Figure 1.8 – Blueprint and Data Diagram at the Logical Level
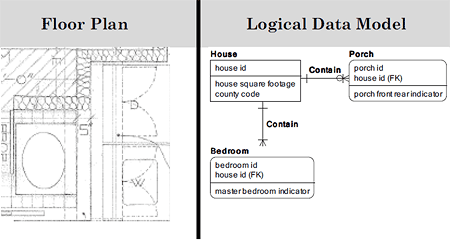
Note that for the house diagram, this level is created by the architect, with input and signoff from me. This also holds true in the data world. A logical data model is normally created by a data modeler/architect, but a business person needs to be heavily involved to make sure that the rules and definitions are represented correctly. After the design of the house meets my needs and requirements, the architect passes the floor plans over to the contractor(s) who create the detailed wiring, plumbing diagrams, etc. Again, for data models, a similar paradigm holds true. While the physical diagram of a house explains how, for example, the wiring is laid out, the physical data model explains how the data is physically laid out and stored on a particular database platform. See Figure 1.9 for an example of a physical data model.
Figure 1.9 – Blueprint and Data Diagram at the Physical Level
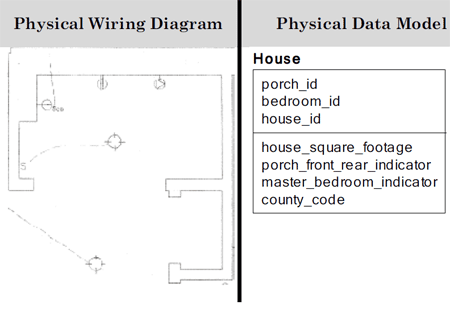
Just as this is normally handled by a contractor specializing in electrical work, for example, database design is often performed by a database administrator (DBA) who specializes in a particular database platform or architecture such as Oracle, Sybase, DB2, or XML. Remember, I really didn't want to see these diagrams — I just wanted to know that they were being built by someone with the right expertise. With data design, a business person should feel the same way. They don't have to be involved in the physical design of a database, but they should have confidence that the database is being designed and built by the appropriate staff.
From this analogy, you can see that a data model, like an architectural diagram for a house, is just a set of shapes and lines that help communicate meaning to both laypeople and technical engineers. We'll explain the notation in a step-by-step manner in Chapter 3, but you should already have a basic sense of what these models can convey just by looking at them.
You can also see from the house analogy that arriving at a common understanding is key to achieving a positive result. I needed to make sure that my architect shared my vision of what I'm looking for in a house. If he's designing a mansion, but I really wanted a small vacation home, the rest of the architectural details around wiring, plumbing, etc. are meaningless — I still wouldn't be happy with the end result. The same holds true in the world of data management and design — if the business people and stakeholders who are using the data are not involved in the design and are not happy with the key concepts in the data model, chances are the end results won't meet their needs and business performance will suffer as a result.
- A data model is a visual representation of the people, places and things of interest to a business and is composed of a set of symbols that communicate concepts and their business rules
- Data models are similar to the architectural diagrams for a house in that they:
- Use a set of graphical images to convey technical information
- Consist of several levels, from a very-high level to describe scope, to a very detailed level describing technical details
- Show relationships between key concepts and objects
- Used to facilitate communication
- Intrigued by this chapter excerpt? Download a free PDF of this chapter: Chapter 1 -- What is a Data Model?
- Read more excerpts and download more sample chapters from our Data Management bookshelf
- To purchase the book or similar titles, visit Amazon.com


